today we'll revisit Cameco corporation technical analysis for online market trading,
you can read the previous posts here
interesting facts:
1- the stock broke the resistance level at 35.12$ up.
2- RSI bullish
3- MACD formed bullish cross.
the stock is in a bullish trend with 38.14$ target. after breaking 38.14$ the stock might rally toward 42$.
We Moved!!
Stock Research
you can also subscribe to its RSS feeds or newsletter to get updated when new analysis is posted
GO ahead and click in!read the latest technical analyis of all the TSX, NYSE, NASDAQ, AMEX stocks and find
hot stocks
enjoy
Shadi
Thursday, February 21, 2008
Cameco Corporation (CCJ) Technical Analysis - revisit
That's all for today ... thanks for reading the post,
come back soon for more updates,
use the search to lookup for more interesting stocks you might be interested in,
feel free to leave your comments on the post, or contact me
enjoy your online market trading!!
have a nice day,
Shadi
to get back to main page click here .
Posted by
Shadi
at
3:23 PM
1 comments
![]()
Labels: ccj
Citigroup Inc (C) Technical Analysis - revisit
today we'll revisit citigroup technical analysis for online market trading, you can read the previous post here.
our bearish advice was in place, and the stock value dropped gaining all short positions and put holders.
now for updates, weekly graph of citigroup shows no bullish signs or recovery,
1- still supported at 24.15 which is the 0% retracement of fibonacci.
2- resistance of MA11 is still valid.
3- RSI resist pattern.
consider shorting the stock or rehedging on break of 24$, suggest long entry only on
29.5$ break.
Posted by
Shadi
at
3:15 PM
0
comments
![]()
Labels: c
Boeing Stock (BA) Technical Analysis - february revisit
Today we'll revisit boeing analysis performed last month (read here)
interesting facts:
1- boeing recovered from 61.8% retracement of hte last bullish move at 83.78$.
2- broke resistance line at 80$.
3- MACD shows the begining of bullish diversion (not complete yet).
4- rsi broke resistance pattern.
next challange for the stock is at 87.2$ value, breaking it would lead to target of 91.72$, failure to do so would take the stock to a bearish sentiment targetted to 83.78$.
Posted by
Shadi
at
3:06 PM
0
comments
![]()
Labels: ba
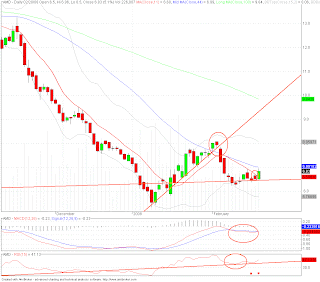
Advanced Micro Devices, Inc (AMD) Technical Analysis february
Today we'll revisit our previous analysis of AMD (read here)
things to notice
1- break of support level at 5.2.2008.
2- RSI forming a bullish pattern,
3- stock value break MA 11 up.
shorterm conclusion, another wave of bullish trend expect AMD stock, targets of the minor trend : 7.08$ and 8$.
Posted by
Shadi
at
3:01 PM
0
comments
![]()
Labels: amd
Applied Materials, Inc. (AMAT) Technical Analysis february
today we'll revisit Applied materials (AMAT) Technical analysis performed last month, you can read it here.
few things to notice:
1- bullish divergence in MACD occured.
2- 19.84$ level of fibonacci (61.8%) was not penetrate where as the 50% was broken up in large volume.
few scenarios that might happen :
1- a fix toward 18.5 stabilization and confirmation of bullish trend toward 19.84 recheck and 22$ break.
2- a break of 18.5 down which will lead to a 18.25 and 17.88 check if no support we will head toward a minor bearish trend of 17.52.
conclusion, AMAT had reached the target set for the last bullish rally, confirmation of support in 18.5 level will lead the stock to new heights.
Posted by
Shadi
at
2:44 PM
0
comments
![]()
Labels: amat
Intel Technical Analysis february revisit
we revisit the last analysis of intel stock (INTC), you can read the previous post here
new developments at intel that require further examination:
1- 22$ resistance, couldnt be broken.
2- creation of support at 19.9$ level.
3- stock volatility drop. the stock is trading in very narrow trade range, 22 - 19.9.
suggested action of buying volatility, buying symmetrical options strtegies before Fed rate decision, (buying put + call), or waiting for one envelope edge to break to enter with the trend.
Posted by
Shadi
at
2:39 PM
0
comments
![]()
Labels: intc


