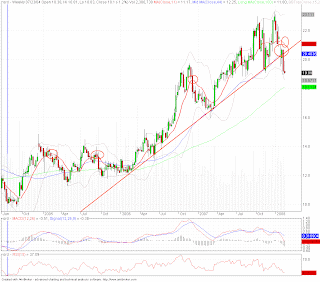
Today we'll analyze general electric company (GE)
we start by noticing few points:
1- the stock broke MA11 which lead to the latest bearish drop.at november 07.
2- the stock broke a support level at Jan 08
3- the stock was supported at support level of 33.55 at Feb 08.
combining these signals, we conclude that the stock is a volatile point, we recommend, enetring short if 33.5$ broken down, or longing the stock, at 35.63$ break up.
We Moved!!
Stock Research
you can also subscribe to its RSS feeds or newsletter to get updated when new analysis is posted
GO ahead and click in!read the latest technical analyis of all the TSX, NYSE, NASDAQ, AMEX stocks and find
hot stocks
enjoy
Shadi
Friday, February 15, 2008
General Electric Company (GE) Technical Analysis
That's all for today ... thanks for reading the post,
come back soon for more updates,
use the search to lookup for more interesting stocks you might be interested in,
feel free to leave your comments on the post, or contact me
enjoy your online market trading!!
have a nice day,
Shadi
to get back to main page click here .
Posted by
Shadi
at
3:06 PM
0
comments
![]()
Labels: ge
eBay Inc. (ebay) Technical Analysis
we'll analyze eBay (ebay) for online market trading.
few notes:
1- ebay broke a traingle formed from a resistance at Jan 06 and a support at Jul 07
the triangle depth is 21.93$. 
2- MA11 was broken with high volume,
3- another support line at 28/12/07 was broken at 33.78$ value.
all in all, very strong bearish signals at ebay,
in particular, the triangle break leads to a move of 1/2 of the triangle depth : 10.965$, targetting at 23.685$ stock value. at this level a further examination will be required.
Posted by
Shadi
at
2:57 PM
1 comments
![]()
Labels: ebay
Oracle Corporation (ORCL) Technical Analysis
We'll analyze Oracle corporation (ORCL) for online market trading.
we'll work on weekly bar chart.
few points to notice:
1- the stock broke the support line on the week of 8/2/2008.
2- MA11 was broken down, a bearish signal, historically for this stock.
3- reached 62% retracement for the latest bullish move at 18.97$.
4- MACD bearish.
overall, the stock is bearish recommend hedging the current holdings by buying puts, or entering short, with target 16.5$.
Posted by
Shadi
at
2:07 PM
0
comments
![]()
Labels: orcl
Countrywide Financial Corporation (CFC) Technical Analysis
Today we'll analyze Countrywide Financial Corporation (CFC) for online market trading,
1- the stock has been trading in a clear envelope since SEP 2008.
2- Bollinger bands are closing, volatility is lowering, as the stock price is "stuck".
3- double bottom at 4.78$.
4- since 1.feb.2008 we see the initiation of a support line (still not formed well).
5- the stock is very close to MA45 breakout.
we recommend a hold on this stock, a long will be initiated at the break of 7.4$ with target of 18.16$ (midrange).
Posted by
Shadi
at
1:58 PM
0
comments
![]()
Labels: cfc


