i like google (GOOG), its an innovative company with lots of user friendly applications,
growing and entering new domains.
however,examining the stock sheds a bearish light on the stock,
i will start with the reasons and go on with the targets, Google main bearish trend composers are
1. a double top around 715$ that couldnt be penetrated while being tested in DEC 2007.
2. a break of a support at 624$.
these two strong technical indications take the stock into a bearish trend in the mid-term,
examining the stock a bit mroe will give us a hint on the targets.
considering fibonacci retracements for the stock, show us that the target of the 50% retracement is 616$ ( which it already broke) while the 66% target is 586$.
ADX shows a strengthening trend, and RSI doesnt show any bullish sign yet.
concluding it all together, google, is short-term bearish with at a first target of 586$.
We Moved!!
Stock Research
you can also subscribe to its RSS feeds or newsletter to get updated when new analysis is posted
GO ahead and click in!read the latest technical analyis of all the TSX, NYSE, NASDAQ, AMEX stocks and find
hot stocks
enjoy
Shadi
Friday, January 18, 2008
Google Inc (GOOG) Short/Mid Term Technical Analysis
That's all for today ... thanks for reading the post,
come back soon for more updates,
use the search to lookup for more interesting stocks you might be interested in,
feel free to leave your comments on the post, or contact me
enjoy your online market trading!!
have a nice day,
Shadi
to get back to main page click here .
Posted by
Shadi
at
9:42 PM
3
comments
![]()
Labels: goog
Advanced Micro Devices, Inc (AMD) Technical Analysis
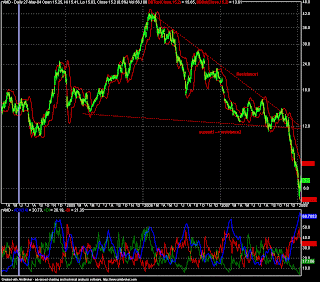
Advanced Micro Devices, Inc (AMD) ... had a very bad last two years in 2006-7
crashing from 42$ to 5.52$.... is the bearish sentiment behinds us?
its interesting to see that the major bearish move was initiated from a broken triangle that was created between the two lines : support1 and resistance 2, that was broken in Nov 07, that lead to the huge drop we saw AMD crashing from 12$ to 5.52$.
we find much interest in the line support1 that became resistance 2, as breaking this line would shed a bullish sentiment on the stock in the midterm. the line is currently resisting around 11.8$.
furthermore,
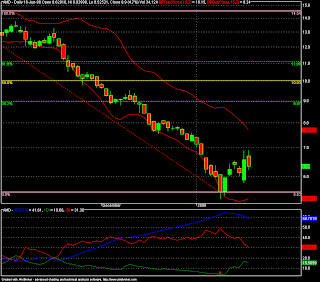
looking at the AMD stock for the last bearish move in Oct07 (14.54$) to Jan08,
AMD formed a support line at 5.52$, examining the retracement of this bearish drop, gives us the following targets : 8.97$, 10.03$.
ADX shows that the trend is still strong.
examining other indicators shows us another 2 bullish signs in AMD stock,
1. the price broke the EMA 14 upward
2. RSI is very bullish
to conclude, AMD is bullish in short term, the midterm trend will be examined at breaking 8.97, 10.03$ and 12$.
Posted by
Shadi
at
8:40 PM
0
comments
![]()
Labels: amd


